Can you really rely on somebody's assertations or statements based on a chart when they can't even interpret that chart properly ?
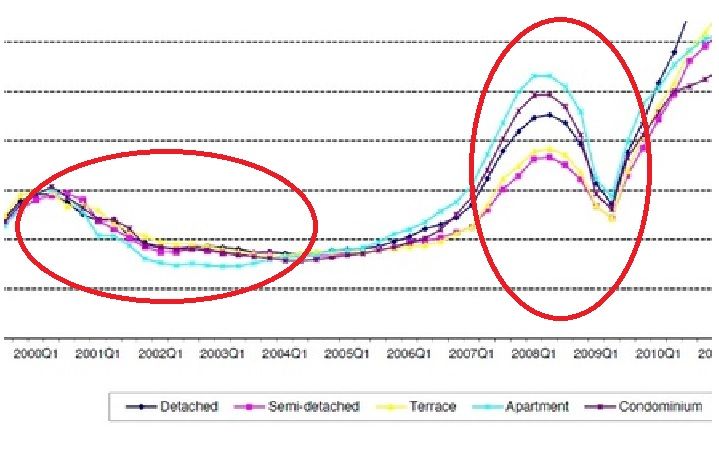
The reason for the crop is simple. Please explain to readers here your statement below (especially the part in red) ,in relation to the chart. I crop it Big in case you are colour blind.Can you tell all here which segments drop the most in 2000 & 2008?
Originally Posted by ringo33


 Reply With Quote