In the article, they only did a theoretical comparison how DSR will move if interest rate rises etc, but it fail to talk about what happen to landed property during a crisis.
In the table, they are using average MI/ Average income.
So my question is consider the massive price gap of landed property and buyer profile for landed property in Singapore, where one end of the spectrum could be a billionaire buying his 3 or 4th investment GCB property costing $20-30m each and bought it with cash, while on the other end could be a average income salary man buying a LH terrace houses that cost <1.5m with 80% loan.
So if 20% of the landed property buyers have an annual income of say >$2m per year and bought their property with minimal or zero loan, will that give you a false impression that most landed owners are making $22k income per month and their average loan about is 1.9m?
Your question already shows that you read but you don't even understand the data or how it is collated. Firstly, if a person bought it with cash, it wouldn't even be captured in the data as it only tracks BORROWERS.
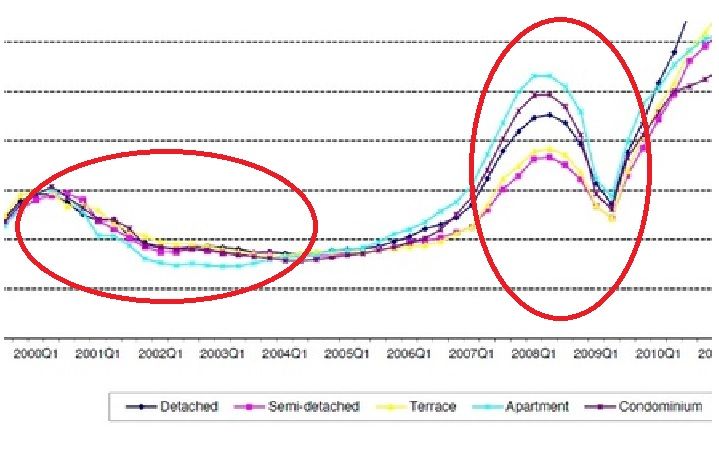
The article also mentioned that in 2003, interest rate rises and all segment except landed property owner exceeded 50% DSR. So my question is, did you see an dip in condo or apartment prices in 2003/4 (see the reality URA Chart)
Here is where you read but don't do your own research. The run-up in interest rate started in 2003 and peaked somewhere in 2006/7. see chart below showing SIBOR rates in blue.
 Because of the lag effect of an interest rate adjustment, this hit home hard in 2008 which btw caused APTs and CONDOS to tumble the most.
And IIRC, the interest rate for during 2000 and 2008 were pretty stable, however we did see a massive price correction of landed property during both period, which I believe DSR for landed owners were clearly <50%.
Do you even know how to interpret you own chart? In 2000, almost all segments were at the same level so how can you say there was a massive price correction just for landed. In 2008, what tumbled the most was APTS followed by CONDOS and NOT landed. Why it happened is explained in my previous answer. Go see the interest rate chart. It just shows that some people read without thinking
So my question is, does this article mean anything in real world?
The answer is YES but only for those who know how to read and understand it properly
And if indeed landed property owners have such good holding power, then why detach houses suffer to most massive price correction during 97-99? where landed property owners different from those we see today?
You have obviously not been following this thread, go back to the beginning and read.


 Reply With Quote